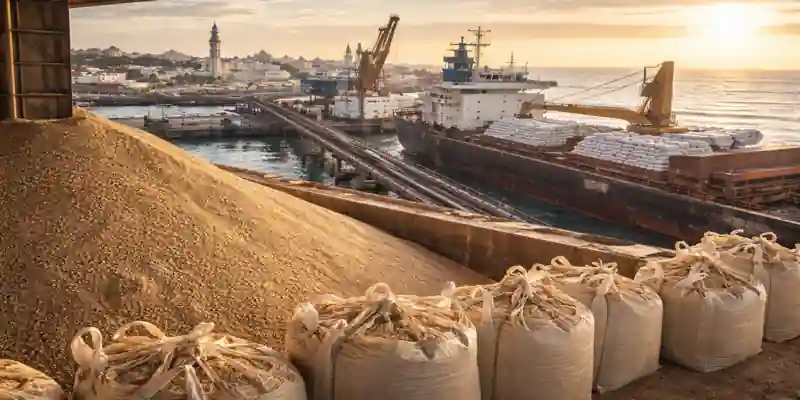
The CBAM charges for nitrogen fertilizers are set to transform Europe’s import structure when the Carbon Border Adjustment Mechanism takes effect in 2026. A leaked Brussels document has revealed projected carbon costs that could reshape how Europe buys and prices urea, nitrates, ammonium sulphate and UAN.
Traders say the early data sends a strong message: urea remains the most cost-efficient nitrogen product under CBAM.
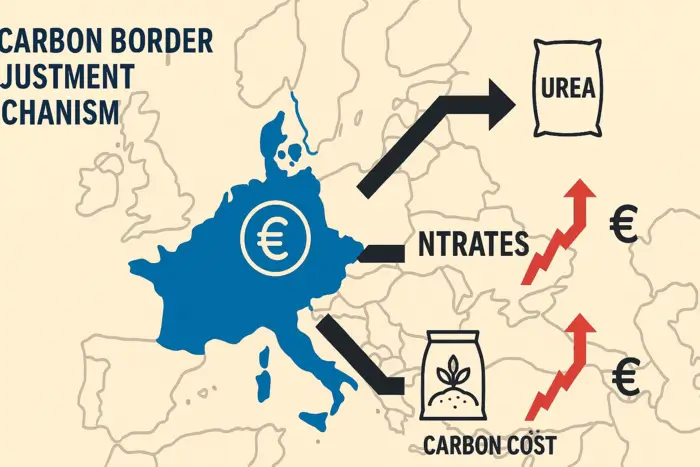
🟦 Why CBAM Charges for Nitrogen Fertilizers Favor Urea
The CBAM charges for nitrogen fertilizers show urea faces the lowest proportional carbon cost, while delivering the highest nitrogen content (46%) per tonne. This gives urea a clear advantage over higher-carbon nitrate products.
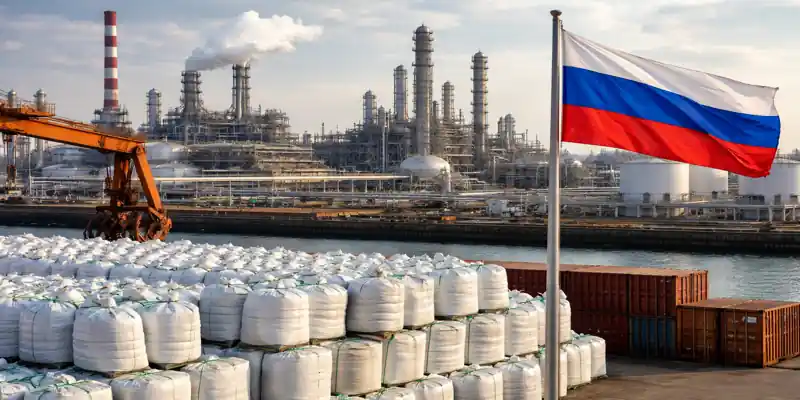
Europe relies heavily on imported urea. The EU imported 6.23mn tonnes in 2024, with Egypt, Russia and Algeria supplying over 87% of total arrivals.
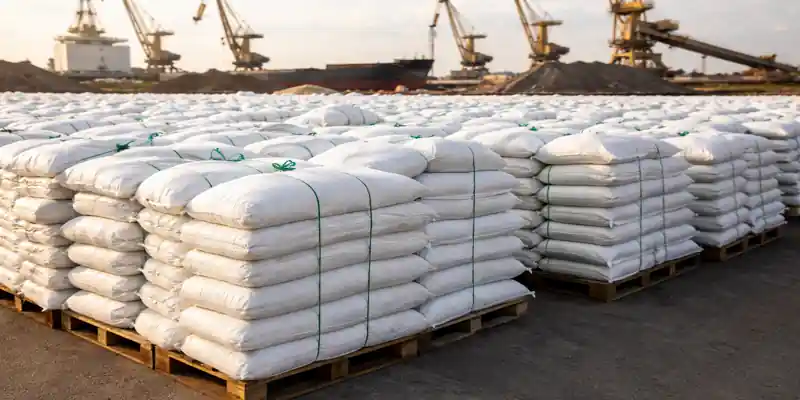
💶 Impact of CBAM on Urea Imports: Who Pays What?
Projected default CBAM costs:
Egypt: €43/t
Algeria: €45/t
Nigeria: €49/t
Russia: €50/t
Uzbekistan & Turkmenistan: €58/t
These represent around 9–12% of EU urea prices. Urea remains competitive because its carbon cost per nitrogen unit is still the lowest among nitrogen fertilizers.
⚠️ How CBAM Affects Nitrate Fertilizers (AN, CAN, UAN)
Urea may benefit, but nitrate fertilizers face steep CBAM penalties:
UAN
€68–95/t
Represents 19–27% of EU UAN pricing.
Ammonium Nitrate (AN)
€155–161/t
A carbon cost equal to 33–38% of the inland price.
Calcium Ammonium Nitrate (CAN)
€115–130/t
Represents 33–37% of market value.
These higher costs could shift demand further toward urea.
⚙️ CBAM Cost Impact on Ammonium Sulphate (Amsul)
Ammonium sulphate shows the widest price variation:
Egypt: €19/t (low impact)
China: €74/t (high impact due to low N content)
China’s amsul, which surged in imports in 2024, may lose competitiveness under CBAM.
🔎 Uncertainty Ahead of 2026 Implementation
Market participants remain unsure how pricing formulas, trade flows and import origins will adjust once the regulation starts on 1 January 2026. However, expectations are clear:
Urea will remain Europe’s dominant imported nitrogen fertilizer.
High-CBAM products like AN, CAN and UAN may see reduced shipments.
Importers may diversify origins to manage carbon costs.
Conclusion: A New Carbon-Driven Fertilizer Market
The latest projections show that CBAM charges for nitrogen fertilizers strengthen urea’s position while challenging higher-carbon nitrate products. Europe’s nitrogen market is set for structural change as carbon pricing becomes a decisive factor in fertilizer trade.
| Theoretical CBAM default charges for nitrogen fertilizers | |||
| Selected origins | Projected CBAM default charge (€/t)** | CBAM default charge per tonne of nitrogen (€)*** | CBAM charge % of major EU price* |
| Urea | 46pc nitrogen | Granular urea fca French Atlantic | |
| Egypt | 43.26 | 0.94 | 9.3 |
| Algeria | 44.92 | 0.98 | 9.6 |
| Nigeria | 49.09 | 1.07 | 10.5 |
| Russia | 49.92 | 1.09 | 10.7 |
| Azerbaijan | 54.92 | 1.19 | 11.7 |
| Turkmenistan | 58.25 | 1.27 | 12.5 |
| Uzbekistan | 58.25 | 1.27 | 12.5 |
| Average | 51.23 | 1.11 | 11.0 |
| UAN | 30pc nitrogen | UAN 30 fca Rouen | |
| Trinidad & Tobago | 68.03 | 2.27 | 19.2 |
| Egypt | 75.53 | 2.52 | 21.3 |
| Russia | 85.53 | 2.85 | 24.1 |
| US | 94.69 | 3.16 | 26.7 |
| Average | 80.94 | 2.70 | 22.8 |
| AN | 33.5pc nitrogen | AN 33.5 cpt France | |
| Russia | 154.91 | 4.62 | 32.8 |
| Georgia | 158.24 | 4.72 | 33.5 |
| Uzbekistan | 160.74 | 4.80 | 34.0 |
| Average | 157.97 | 4.72 | 33.4 |
| CAN | 27pc nitrogen | CAN 27 cif inland Germany | |
| Egypt | 115.45 | 4.28 | 33.2 |
| Russia | 129.61 | 4.80 | 37.3 |
| Ukraine | 129.61 | 4.80 | 37.3 |
| Turkey | 130.44 | 4.83 | 37.5 |
| Average | 126.28 | 4.68 | 36.3 |
| Amsul | 21pc nitrogen | Granular amsul fob NW Europe | |
| Egypt | 19.51 | 0.93 | 8.0 |
| Russia | 22.84 | 1.09 | 9.3 |
| Serbia | 22.84 | 1.09 | 9.3 |
| China | 74.49 | 3.55 | 30.4 |
| Average | 34.92 | 1.66 | 14.2 |
Sources : Argus